IC Markets Home Assinar em Web Trader Contacte-nos
IC Markets Social IC Markets Social

Centro de Informação para
Traders Sérios

  • Sobre nós
  • ABRA UMA CONTA DE NEGOCIAÇÃO
  • TESTE UM DEMO GRATUITO
  • Comece a Operar
  • Visite nosso blog
IC Markets Social
  • Sobre nós
  • ABRA UMA CONTA DE NEGOCIAÇÃO
  • TESTE UM DEMO GRATUITO
  • Comece a Operar
  • Visite nosso blog
November 30, 2022North_American_Stocks_enIC Markets

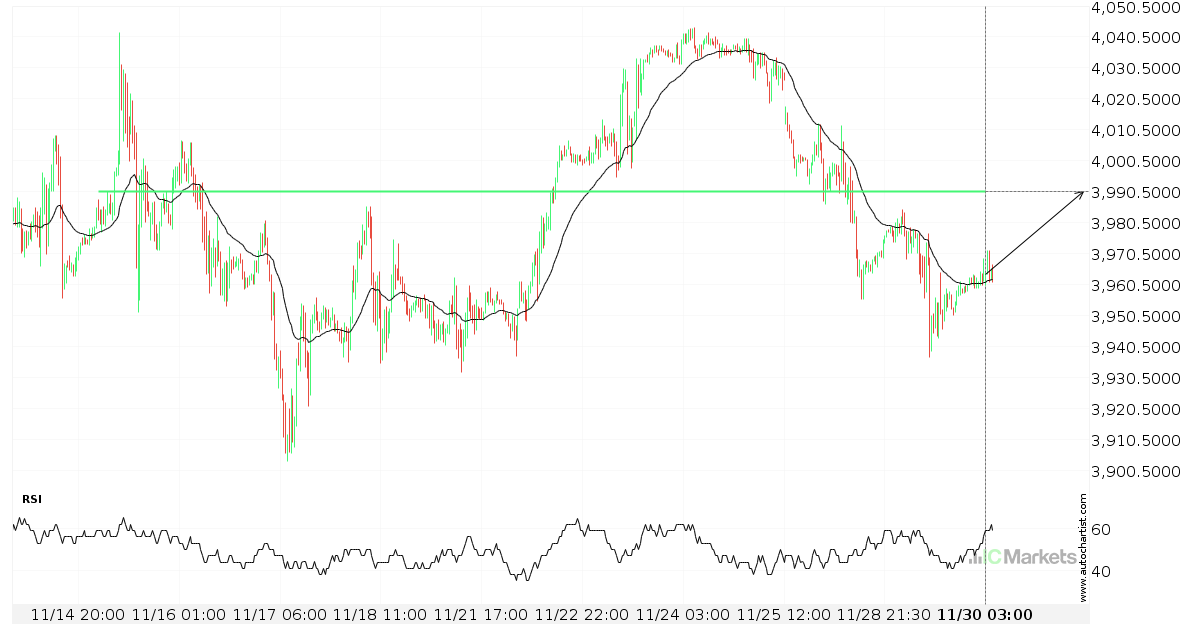
A final push possible on US SPX 500 Index

US SPX 500 Index is heading towards 3990.7000 and could reach this point within the next 3 days. It has tested this line numerous times in the past, and this time could be no different, ending in a rebound instead of a breakout. If the breakout doesn’t happen, we could see a retracement back down […]

Read more
November 29, 2022North_American_Stocks_enIC Markets

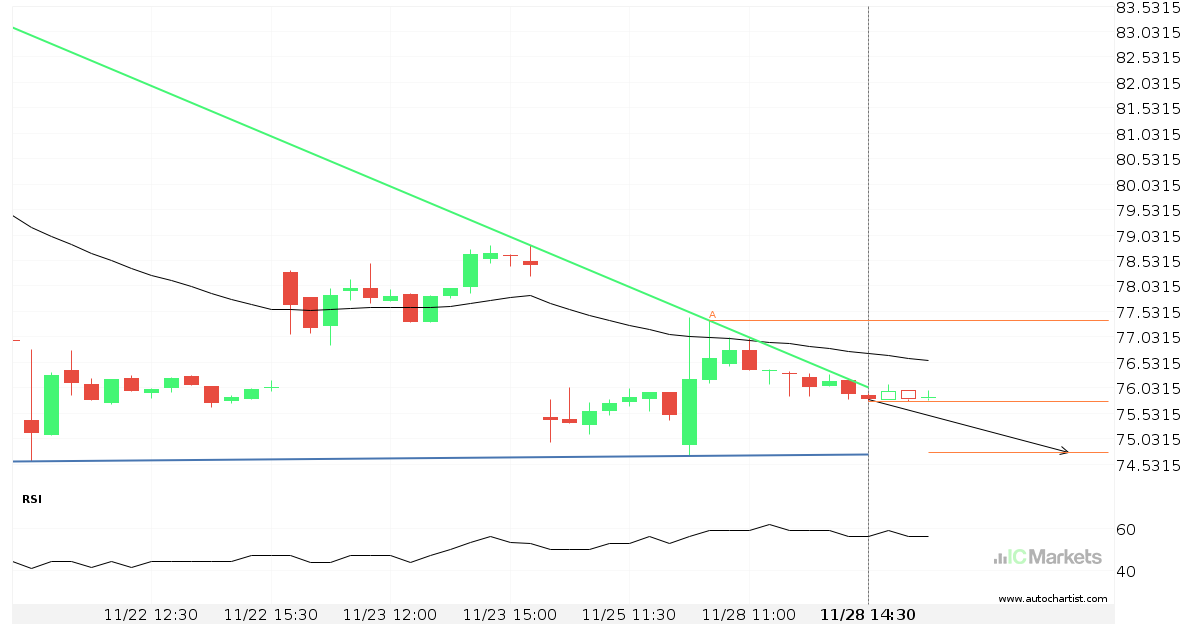
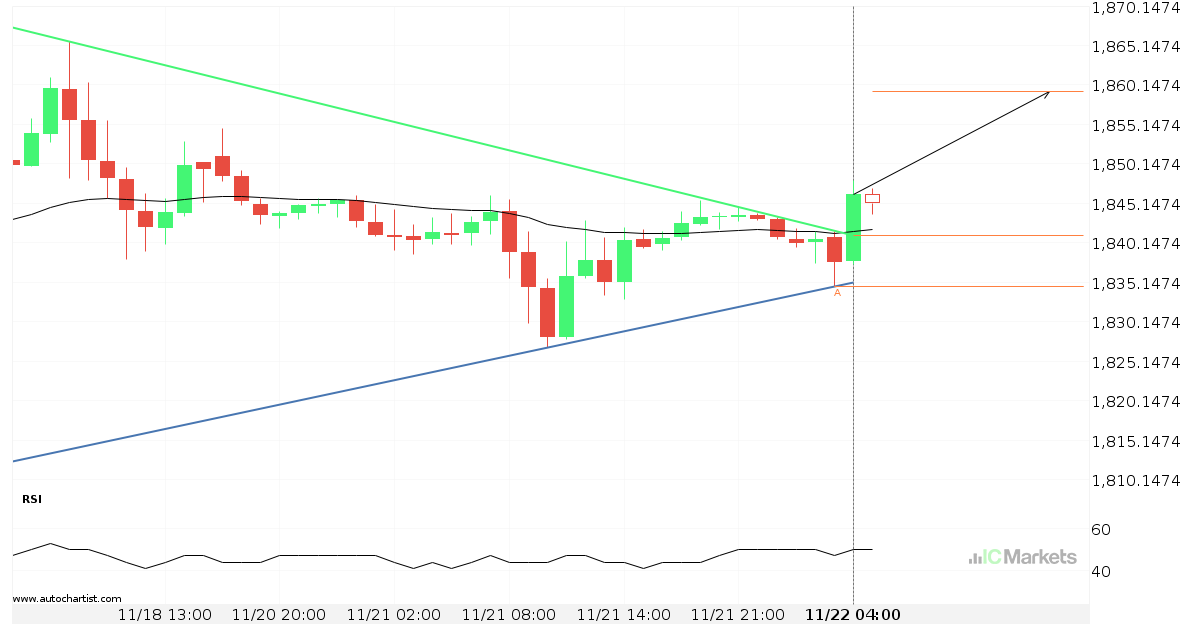
Alibaba Group Holding Limited – getting close to support of a Descending Triangle

Alibaba Group Holding Limited is moving towards a support line. Because we have seen it retrace from this line before, we could see either a break through this line, or a rebound back to current levels. It has touched this line numerous times in the last 12 days and may test it again within the […]

Read more
November 28, 2022North_American_Stocks_enIC Markets

Possible breach of support level by US Tech 100 Index

US Tech 100 Index is moving towards a support line which it has tested numerous times in the past. We have seen it retrace from this line before, so at this stage it isn’t clear whether it will breach this line or rebound as it did before. If US Tech 100 Index continues in its […]

Read more
November 25, 2022North_American_Stocks_enIC Markets

Possible start of a bullish trend on US Tech 100 Index

US Tech 100 Index has broken through a line of 11862.9004. If this breakout holds true, we could see the price of US Tech 100 Index heading towards 12005.8799 within the next 2 days. But don’t be so quick to trade, it has tested this line numerous times in the past, so you should probably […]

Read more
November 24, 2022North_American_Stocks_enIC Markets

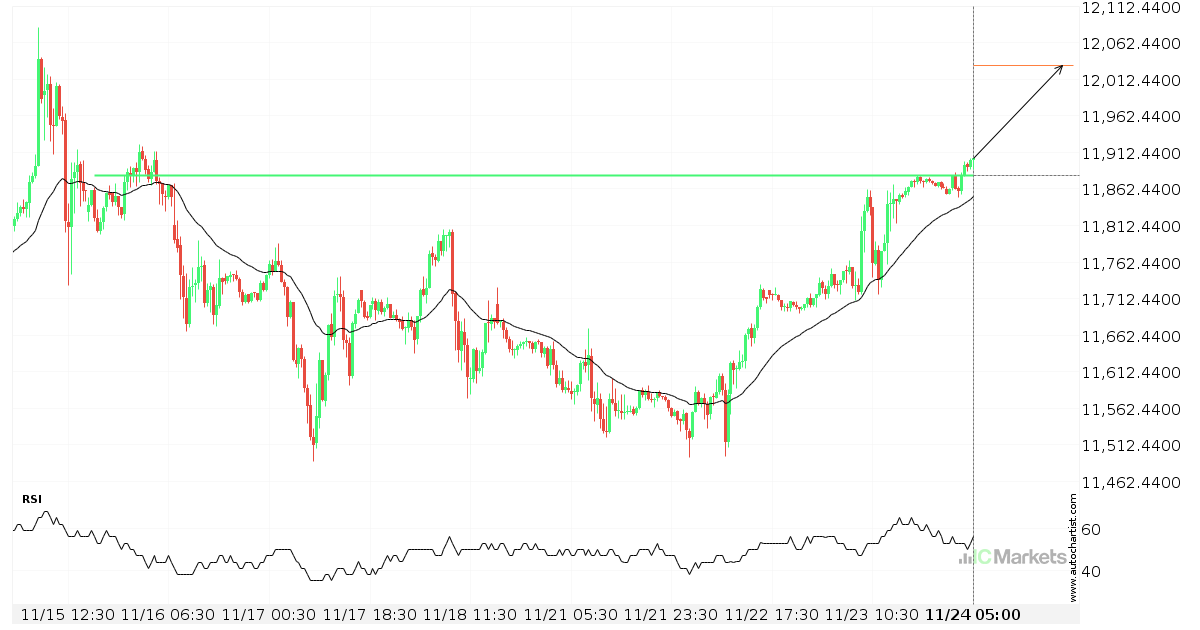
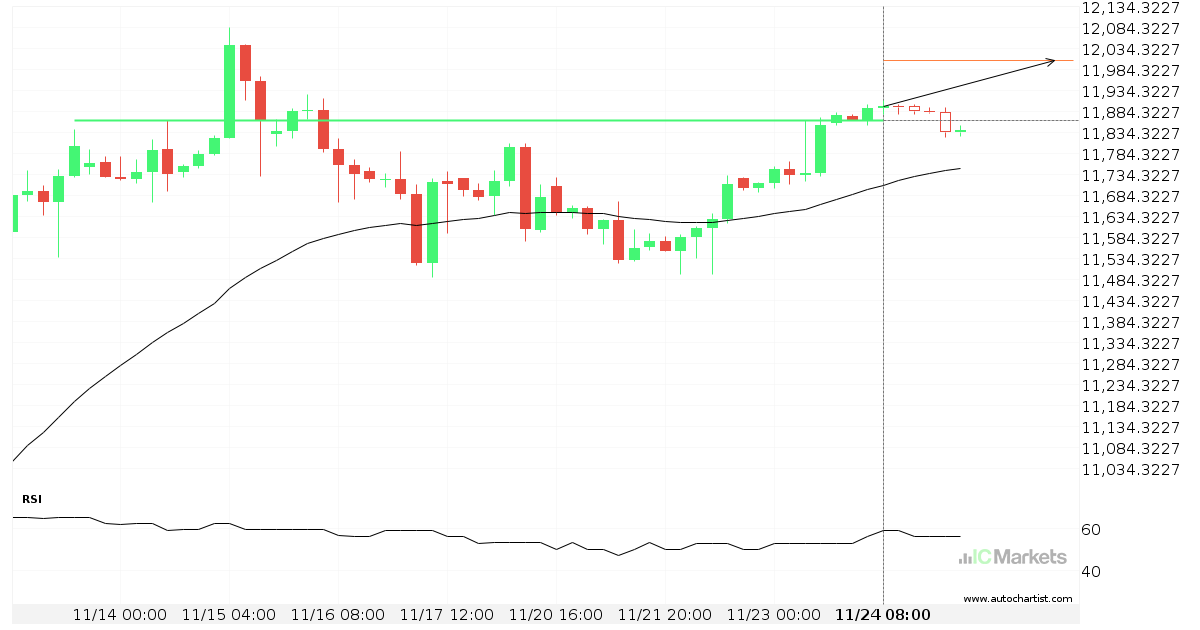
US Tech 100 Index broke through important 11880.2002 price line

US Tech 100 Index has broken through a resistance line. It has touched this line numerous times in the last 9 days. This breakout shows a potential move to 12031.6299 within the next 2 days. Because we have seen it retrace from this level in the past, one should wait for confirmation of the breakout.

Read more
November 23, 2022North_American_Stocks_enIC Markets

Possible breach of resistance level by US Small Cap 2000 Index

US Small Cap 2000 Index is moving towards a resistance line which it has tested numerous times in the past. We have seen it retrace from this line before, so at this stage it isn’t clear whether it will breach this line or rebound as it did before. If US Small Cap 2000 Index continues […]

Read more
November 22, 2022North_American_Stocks_enIC Markets

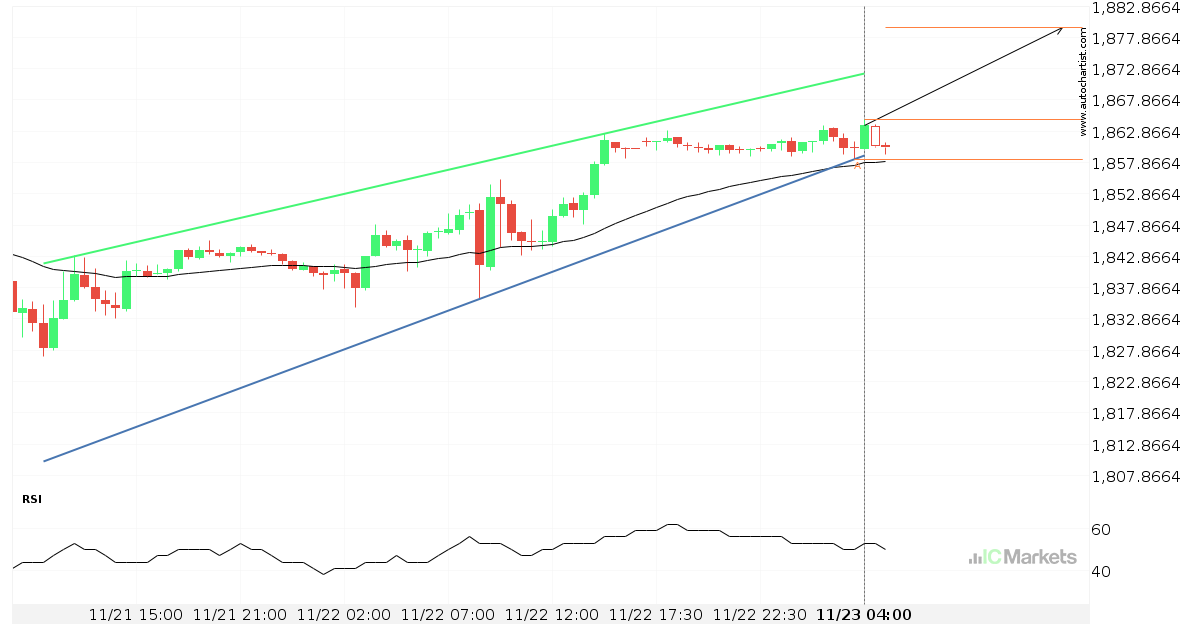
Resistance line breached by US Small Cap 2000 Index

US Small Cap 2000 Index has broken through the resistance line which it has tested twice in the past. We have seen it retrace from this line before, so one should wait for confirmation of the breakout before trading. If this new trend persists, a target level of around 1859.2883 may materialize within the next […]

Read more
November 21, 2022North_American_Stocks_enIC Markets

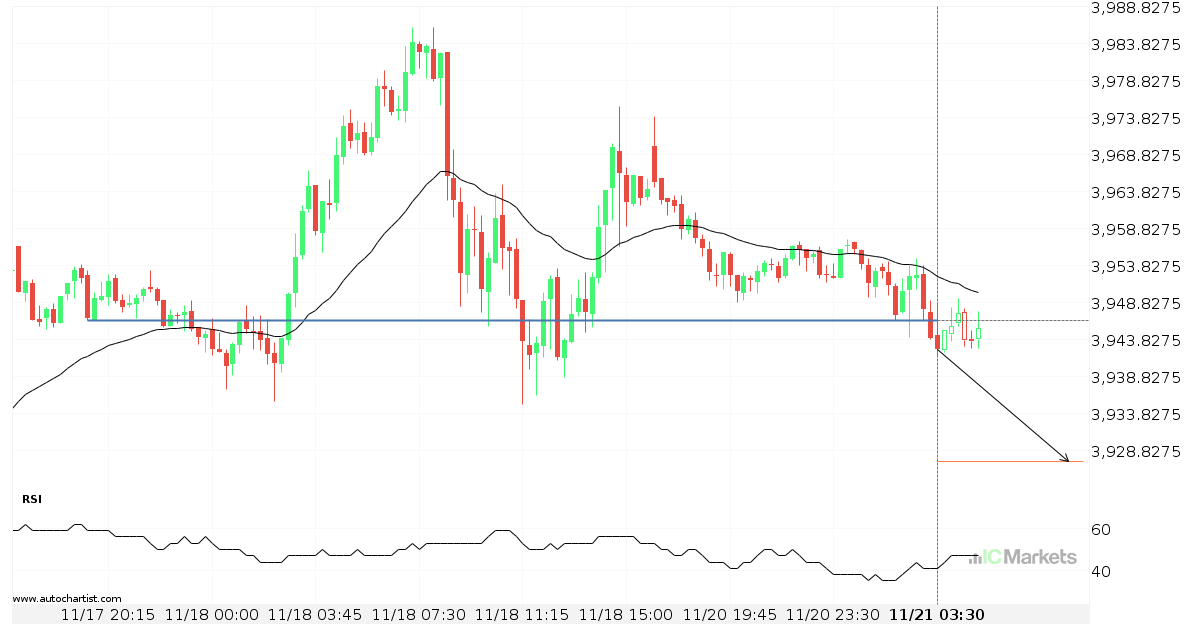
US SPX 500 Index broke through important 3946.3999 price line

US SPX 500 Index has broken through a support line. It has touched this line numerous times in the last 4 days. This breakout shows a potential move to 3927.3501 within the next 6 hours. Because we have seen it retrace from this level in the past, one should wait for confirmation of the breakout.

Read more
November 18, 2022North_American_Stocks_enIC Markets

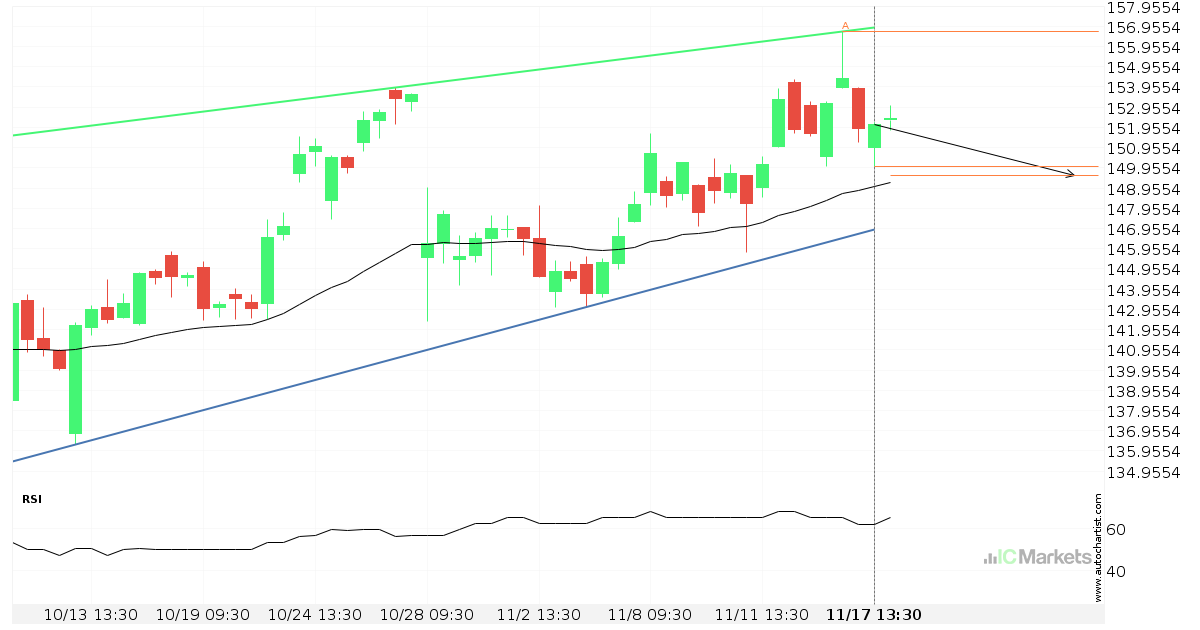
Possible breach of support level by AbbVie

AbbVie is moving towards a support line which it has tested numerous times in the past. We have seen it retrace from this line before, so at this stage it isn’t clear whether it will breach this line or rebound as it did before. If AbbVie continues in its current trajectory, we could see it […]

Read more
November 17, 2022North_American_Stocks_enIC Markets

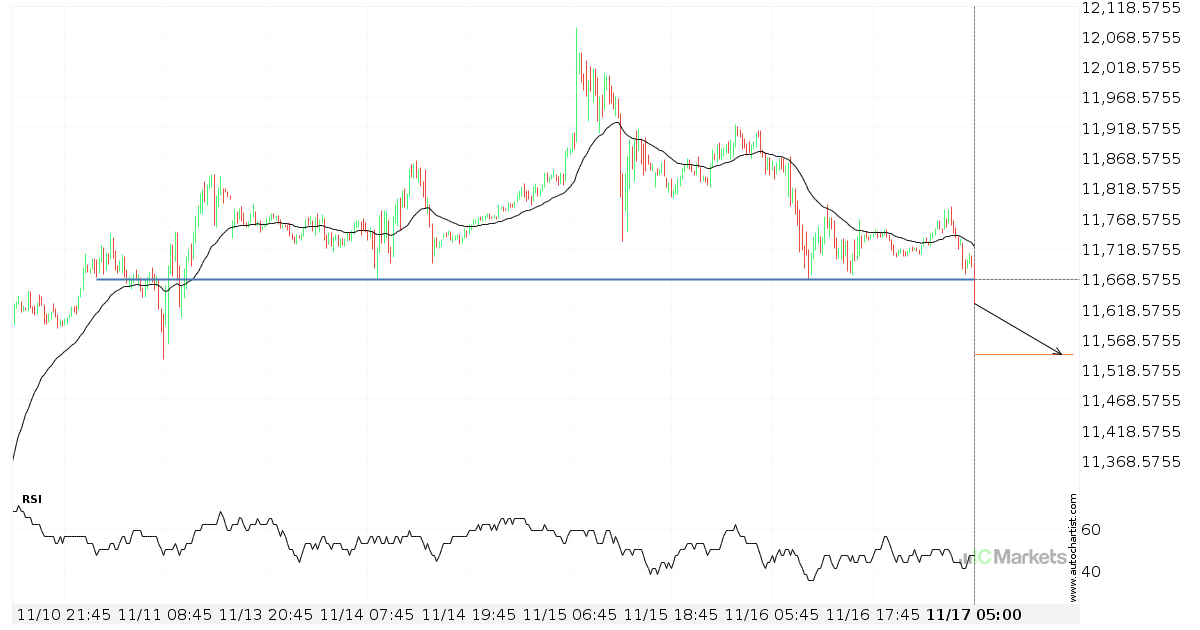
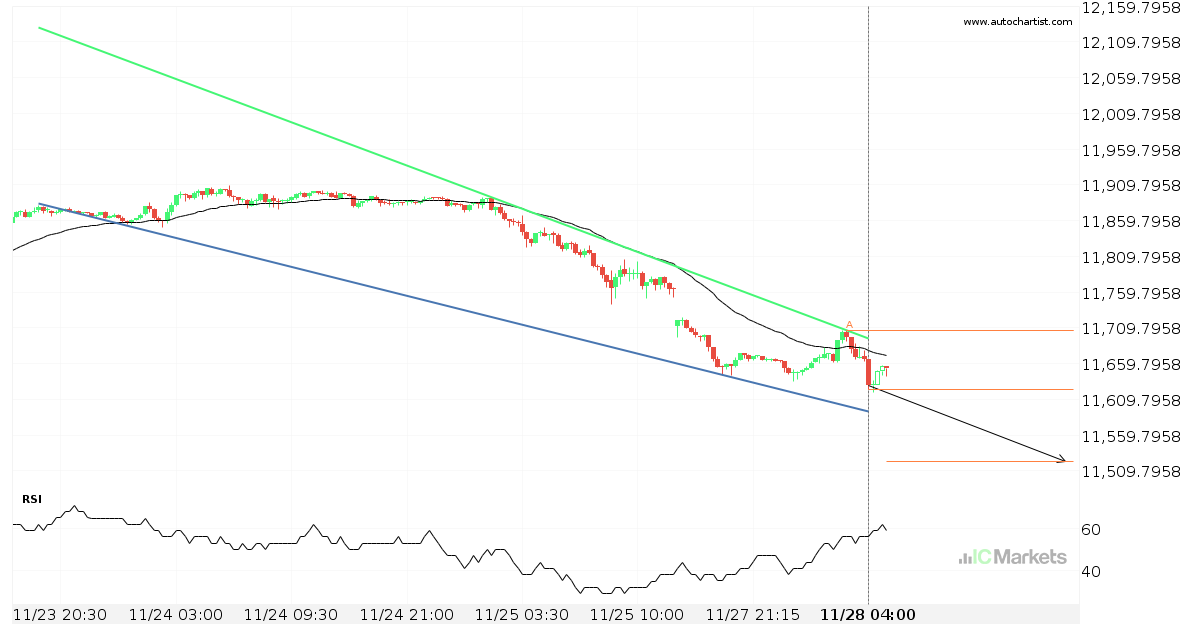
US Tech 100 Index broke through important 11667.0000 price line

US Tech 100 Index has broken through a support line. It has touched this line numerous times in the last 7 days. This breakout shows a potential move to 11544.1602 within the next 2 days. Because we have seen it retrace from this level in the past, one should wait for confirmation of the breakout.

Read more
  • 1
  • 2
  • 3
  • 4
  • …
  • 45
  • 46
  • 47

Recent Posts

  • Either a rebound or a breakout imminent on SILVER
  • GOLD Nível visado: 2976.3601
  • A potential bearish movement on GOLD
  • มีโอกาสเกิดการเคลื่อนตัวแบบ bearish บน GOLD
  • Posible gran movimiento en el AUDJPY

Recent Comments

    Translation


     Edit Translation

    Negocie com um

    líder de mercado no qual possa confiar

    ABRA UMA CONTA DE NEGOCIAÇÃO TESTE UM DEMO GRATUITO

    Trading com Forex

    • Visão Geral de Contas
    • Abrir uma Conta
    • Lançar Web Trader

    Especificações de Trading

    • Spreads e Comissões
    • Gama de Mercados
    • Horas de Trading
    • Financiamento
    • Levantamento

    Acerca da IC Markets?

    • Help Center
    • Porquê a IC Markets
    • Regulamentação
    • Documentos Legais
    • Contacte-nos


    Forex Trading

    • Accounts Overview
    • Open an Account
    • Launch Web Trader

    Trading Specifications

    • Spreads and Commissions
    • Range of Market
    • Trading Hours
    • Funding
    • Withdrawal

    About IC Markets

    • Chat with a Specialist 24/7
    • Why IC Markets
    • Regulation
    • Legal Documents
    • Contacte-nos

    Isenção de Responsabilidade: Este material corresponde a material de marketing em que todo o material de marketing é publicado apenas para fins informativos. Este material não contém e não deverá ser considerado como contendo - aconselhamento de investimento e recomendações ou sugestões para adotar quaisquer ações relativamente a instrumentos financeiros. Os widgets incorporados pertencem aos seus autores externos independentes e a IC Markets não é responsável pelo seu conteúdo ou pelo seu impacto na negociação.

    Todos os direitos de conteúdo reservados. As opiniões dos autores poderão não coincidir com a opinião dos editores do blog. Aquando da cópia de materiais a partir deste site ou aquando da ligação ao RSS feed, para republicar os nossos artigos, é necessário um link para a IC Markets ou a atribuição no formato 'IC Markets Blog'. Para questões gerais, por favor, entre em contato com a agência editorial através do formulário da nossa página de Contato.

    Alerta de Risco: A negociação de Derivados acarreta um elevado nível de risco para o seu capital e deverá negociar apenas com dinheiro cuja perda possa suportar. A Negociação de Derivados poderá não ser adequada para todos os investidores e, como tal, por favor, certifique-se de que entende plenamente os riscos envolvidos e procure aconselhamento independente, se necessário. Deverá ser considerada uma Declaração de Divulgação de Produto (PDS) antes de efetuar uma transação connosco.

    O conteúdo desta página corresponde apenas a informação geral e não tem em conta a sua situação pessoal, objetivos ou necessidades financeiras. Cabe-lhe a si certificar-se de que os produtos que nós oferecemos se adequam às suas necessidades específicas. Não deverá negociar connosco, a menos que entenda as caraterísticas e os riscos dos produtos que nós oferecemos. Isto significa que poderá precisar de procurar aconselhamento independente antes de começar a negociar connosco.

    © 2022 Raw Trading Ltd | All rights reserved.
    • Sample Page